As with all of Vehicle Vision’s products our Sales software gives you the tools to report on your videos and everything that is achieved by sending personalised presentations to your customers.
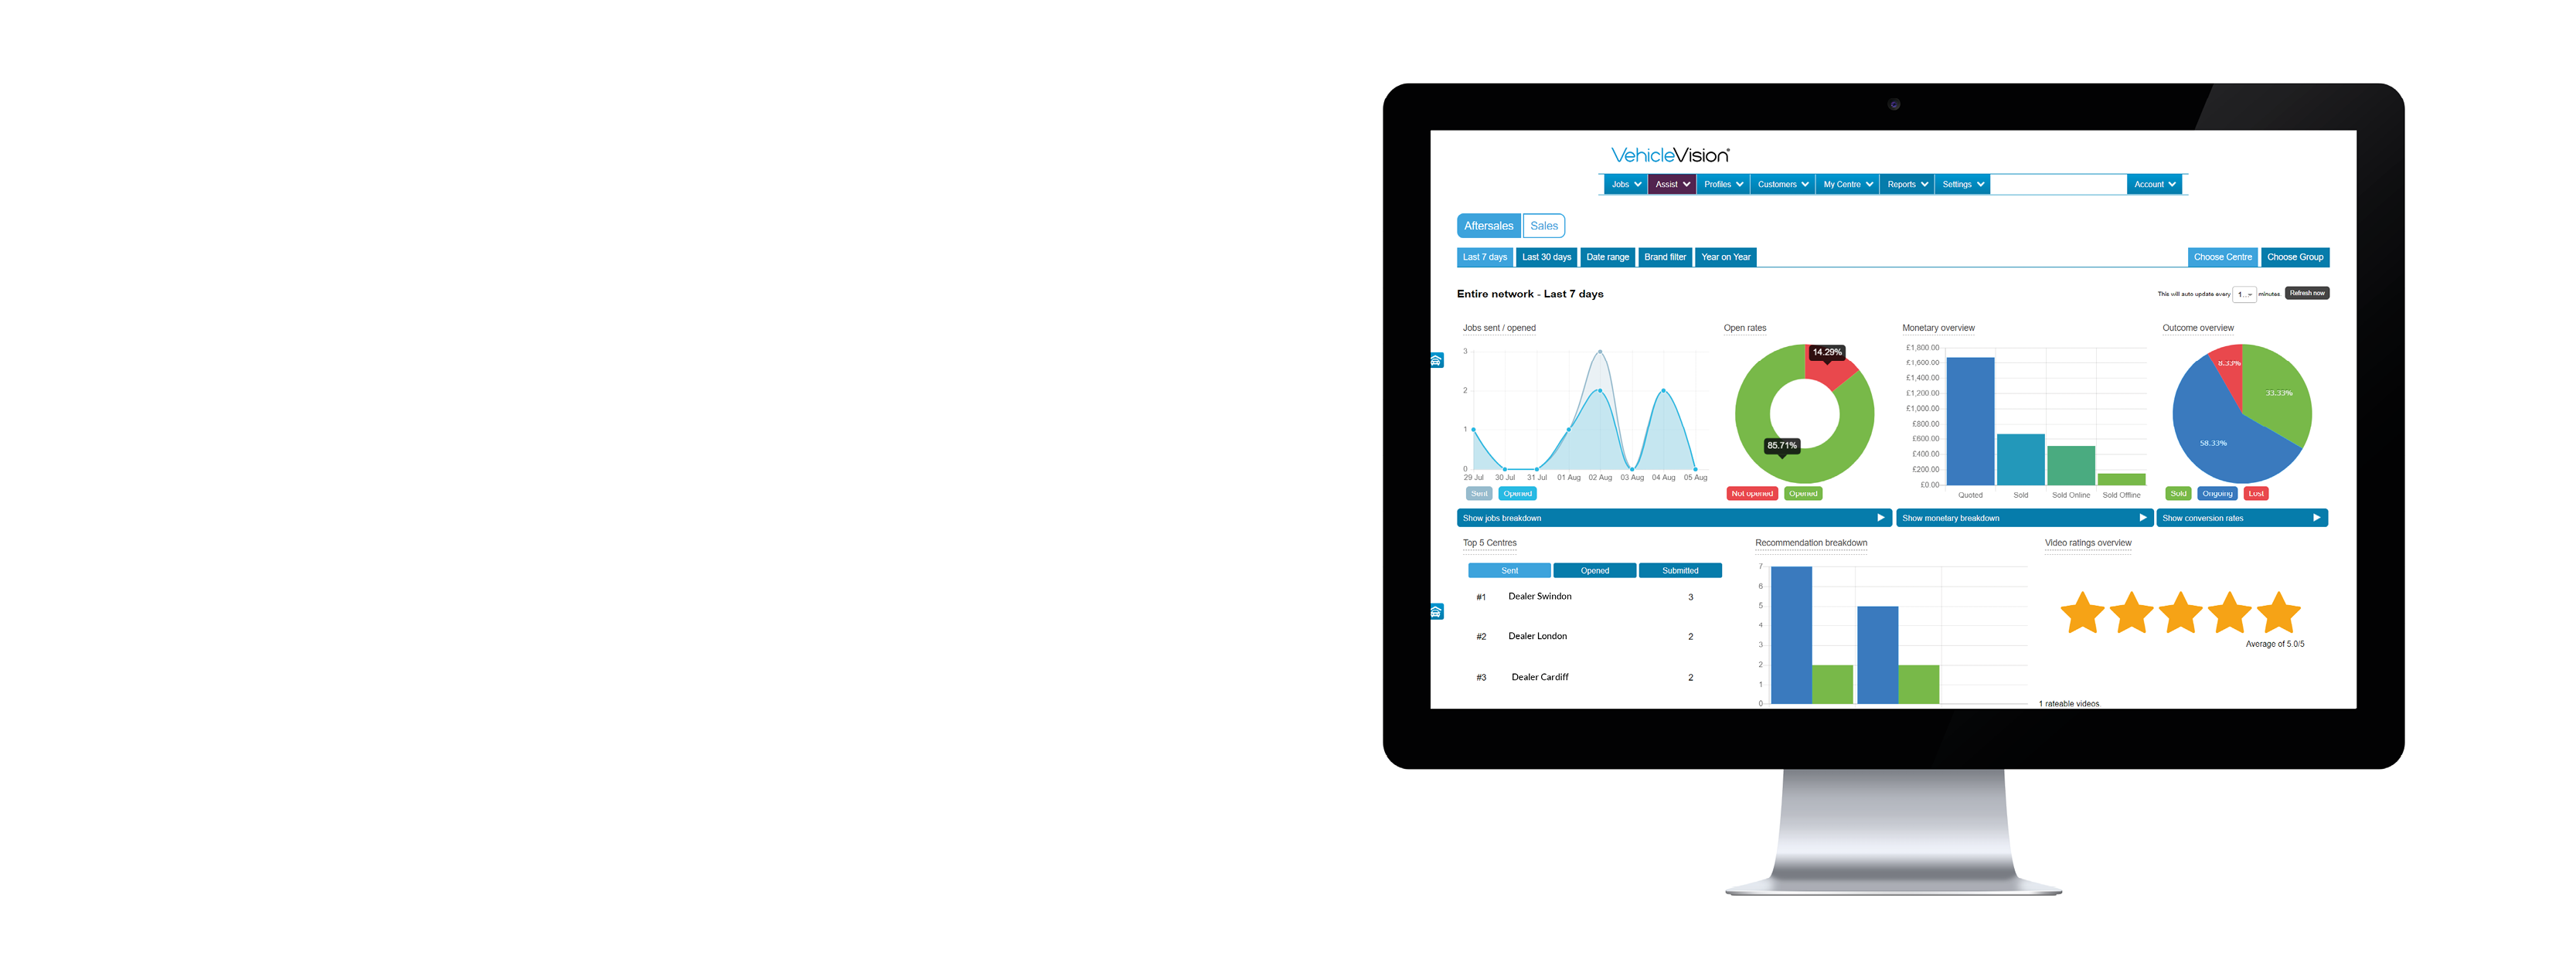
The main dashboard holds all your data and can be used to see immediately how your business is performing.
In the Sales dashboard, data can be viewed at dealership level, regional area, for a particular group or indeed the entire network installation.
Data is displayed in real time, and you are presented with a quick summary of key items:
• Video presentations sent and opened
• Open rates
• An overview of outcomes, sold ongoing or lost
• Number of video presentations by type, enquiry, general or renewal
• The conversion rates of each type of video presentation
• Average video ratings
From here you can drill down into the presentations, and see user activity and the same can be done for conversions too. You can go further by exporting reports for granular data and offline analysis.
If surveys have been turned on, you will be able to see your customer’s survey submissions and the data too.
Email activity reports can be sent to the required recipients at the dealership or in the Sales department on a daily, weekly or monthly basis. These reports can also be sent to other interested parties, for example a group sales manager.
In these reports you can see the figures for presentations created, sent and opened, in totals and by user and type. The report also shows you open rates for your videos.
To configure the recipient list of reports and the frequency, navigate to My Centre, select Centre details and scroll to the Sales Email Reports section. Enter the recipients email addresses and at what frequency you with the recipients to receive the automated email reports.